

Eight metrics decide whether a service level agreement holds up: availability (uptime), mean time to recovery (MTTR), first response time, average resolution time, error rate, first contact resolution (FCR), escalation rate and security/compliance checks. If you track nothing else, track these — they cover detection, response and resolution, which is where most contract disputes originate.
Three of those eight do the heavy lifting. Availability, MTTR and response/resolution time are what most commercial contracts actually penalise, because they map directly to the customer's experience of downtime and delay. Get those three right and you protect the relationship even if everything else is imperfect.
The rest earn their place depending on what you run. A support desk needs FCR and abandonment rate. A field service operation cares more about first time fix and engineer response windows. Security and compliance checks (patch lag, certificate renewal, audit completion) matter wherever a breach carries regulatory weight, not just commercial embarrassment.
- Availability/uptime — the percentage of time a service met its agreed operating threshold
- MTTR — average time from incident detection to full recovery
- First response time — how quickly a customer gets acknowledgement, not resolution
- Average resolution time — how long a case takes end to end
- Error rate — the proportion of requests, transactions or jobs that failed outright
- First contact resolution — cases closed without escalation or a repeat contact
- Escalation rate — how often cases move beyond the first line of support
- Security/compliance checks — patch currency, certificate validity, audit completion
Table of Contents
- What each SLA metric actually measures, and how to calculate it
- How do SLIs, SLOs and SLAs actually relate?
- How to choose the right SLA metrics for your service
- Measuring and reporting SLA compliance: the process that holds up
- Common mistakes that undermine SLA programmes
- How an operations platform reduces measurement error
- Common benchmarks and targets for SLA metrics
- Challenges and pitfalls in defining and tracking SLA metrics
- Impact of SLA metrics on customer satisfaction and business performance
- What the research gets right, and where it stops short
- Get audit-ready SLA evidence without the spreadsheet reconciliation
- Sources
What each SLA metric actually measures, and how to calculate it
Definitions sound simple until two teams calculate the same metric two different ways and produce two different compliance percentages for the same month. Here is how to make each calculation unambiguous.
- Availability/uptime. The formula is (total time minus downtime) divided by total time, expressed as a percentage. The detail that trips people up is the measurement window: daily, monthly and 30-day rolling windows all produce different numbers from the same raw incident data, so specify which one governs the contract before a dispute forces the conversation. A jump from 99.9% to 99.99% sounds trivial but represents the difference between roughly 43 minutes of downtime a month and about four minutes. That gap is usually where the pricing tier sits.
- MTTR (mean time to recovery). Start the clock at verified incident detection, not at the moment someone happened to notice. Stop it at full service restoration, not at "we think it's fixed." Decide upfront whether customer-induced delays (a site visit blocked by access issues, for instance) count against your MTTR or get logged separately, because leaving that ambiguous is how MTTR figures get argued over months after the fact.
- First response time vs average resolution time. These measure different things and both belong in a well-built SLA. First response time confirms someone is on it; average resolution time confirms the problem actually went away. A desk that replies in ninety seconds but takes four days to close tickets is not performing well, whatever its first-metric dashboard says.
- Error rates. Define what counts as a failure before you define the rate. A failed transaction, a defective unit, a job requiring rework, an SLA breach itself, can each be the numerator depending on the service. Choose a denominator that reflects real volume (total transactions, total jobs completed) rather than a cherry-picked subset, and translate the resulting rate into a cost figure wherever you can, since a 2% error rate on 50,000 monthly transactions is a very different business problem to 2% on 500.
- FCR, abandonment rate and average handling time (AHT). Common practical monitoring includes first contact resolution, tickets resolved within SLA and escalation rate alongside uptime. These belong in a contractual SLA only when the underlying process is stable enough to hold a fixed target; a newly launched support line rarely has the baseline data to commit to an FCR percentage on day one.
- Security and compliance checks. Treat patch lag, certificate expiry and audit completion as measurable SLA items with their own targets, not as background hygiene. A certificate that lapses two days late is a compliance breach with the same contractual weight as a missed response window, and it should be reported the same way.
Pro Tip: Log every metric's calculation method in the SLA document itself, in plain language, not just the target. A dispute over what "resolved" means costs far more time than writing one extra clause up front.
How do SLIs, SLOs and SLAs actually relate?
Three acronyms, three different jobs. An SLI (service level indicator) is a raw measurement, like the percentage of requests served under 200 milliseconds this week.
That gap between SLO and SLA is deliberate. Site reliability engineering practice treats it as an error budget: the SLO gives the operations team room to absorb normal variance without triggering a contractual breach every time reality dips slightly below target. Set the SLA equal to the SLO and every ordinary bad week becomes a customer-facing incident.
The practical sequence matters more than the definitions:
- Instrument the SLI first. You cannot set a sensible target for something you have never measured.
- Segment by customer or account tier before you aggregate anything. A single blended uptime number can hide one enterprise customer having a terrible month.
- Count only legitimate, in-scope requests towards SLA accounting. Scheduled maintenance windows, test traffic and customer-side outages usually get excluded, but only if the contract says so explicitly.
Skip the sequence and you get the most common SLA failure mode: a sales team promises an SLA before anyone measured the SLO baseline. KPIs and SLAs serve different masters — a KPI is an internal indicator with no contractual teeth, while an SLA carries commercial remedies when breached. Negotiating the second without ever running the first is how businesses end up penalised for performance nobody actually verified was achievable.
How to choose the right SLA metrics for your service
Every service could theoretically track fifty metrics. The discipline is picking the handful that are controllable, measurable and visible to the customer, because a metric your team cannot influence, or cannot reliably measure, has no place in a contract.
- Map the critical customer journeys. Start with what the customer actually experiences: logging into a platform, raising a fault, getting an engineer on site. Metrics that don't attach to one of these journeys are usually vanity numbers.
- Identify the breakpoints. For each journey, find the one or two moments where delay or failure causes the most damage. For a support desk, that's usually first response and resolution. For field service, it's typically time to first fix.
- Choose three to five metrics per journey. More than that and reporting becomes noise nobody reads. Experts consistently warn against tracking too many metrics, because a dashboard with thirty indicators hides the two that actually predict a breach.
- Set the SLO before the SLA. Run the metric internally for a full review cycle, see what's realistically achievable, then set the SLA a comfortable margin below it.
- Segment by tier, criticality and region. A platinum-tier customer's response window should differ from a standard tier's, and a service running across multiple time zones needs SLA windows that account for local business hours rather than one blanket target.
For an infrastructure service, that usually means uptime, error rate and MTTR. A support desk leans on first response time, resolution time and FCR. A field service operation typically tracks first time fix rate, engineer response window and job completion time against the appointment slot. All three sets are short, deliberately, because a contract nobody can audit against real data is worse than no contract at all.
Measuring and reporting SLA compliance: the process that holds up
Compliance percentage for a review period is calculated as the number of instances that met the target, divided by the total number of eligible instances, multiplied by 100. That formula holds whether you're measuring uptime over a month or response time over a single week, but the eligibility rule is where most reporting disputes start.
SLA compliance is typically processed as a running record per review period, updated at defined sampling intervals, checked against milestone thresholds, and aggregated into an impact cost where breaches carry a financial or service credit consequence. That means compliance is not a single end-of-month calculation. It's a live record that accumulates evidence throughout the period, which is exactly why it needs to be instrumented properly from day one rather than reconstructed retrospectively from memory and email threads.
Four instrumentation sources typically feed that record, and reconciling them is the real work:
- System logs for raw event timestamps
- Monitoring probes for uptime and performance sampling
- ITSM tickets for the human-facing timeline of acknowledgement, assignment and resolution
- Job or work order records for field service completion evidence
| Review cycle | What gets checked | Typical output |
|---|---|---|
| Daily sampling | Uptime probes, error thresholds | Early warning of drift before monthly rollup |
| Weekly milestone check | Response and resolution times against target | Flag accounts trending towards breach |
| Monthly compliance calculation | Aggregated compliance percentage per metric | Customer-facing SLA report |
| Quarterly review | Trend across months, repeat offenders by account | Contract renegotiation input |
Reporting itself needs three components to be trustworthy: a dashboard showing live status against target, alerts that fire when an account approaches breach territory rather than only after it happens, and an audit trail that ties every compliance figure back to the underlying timestamped record. Without that trail, a customer report is just an assertion.
The pitfalls cluster around edge cases the formula doesn't naturally handle. Reopened incidents are the biggest one: does a ticket that gets reopened three days after "resolution" count as one incident with a longer resolution time, or a fresh incident with a new clock? Ineligible requests are the second: test traffic, out-of-scope tickets and customer-caused delays need a clear exclusion rule, agreed in advance, or they'll quietly distort your numbers in whichever direction favours the argument being made. Time zone and account segmentation errors round out the list. A single blended figure across regions or tiers hides exactly the accounts most at risk of a genuine breach.
Common mistakes that undermine SLA programmes
The single most common failure is tracking too many metrics. A report with twenty indicators doesn't communicate performance, it buries it. Keep the set focused on what's controllable and tied to a genuine business outcome, and be willing to retire a metric that nobody has acted on in six months.
The second failure is committing to an SLA before the SLO baseline exists. An SLA needs to rest on a measured baseline, not an aspiration.
A few other habits separate teams that run defensible SLA programmes from teams that argue about them every quarter:
- Run internal KPI buffers slightly tighter than the external SLA, so drift shows up on your dashboard before it shows up on the customer's invoice credit.
- Document every incident timeline and every customer communication as it happens, not reconstructed afterwards. That record is your evidence if a breach is disputed.
- Watch for rising MTTR trends, incidents clustering around a specific account or asset, and growing reopen rates. Each is an early signal that a breach is coming, well before the compliance percentage confirms it.
Pro Tip: If your reopen rate climbs for one particular account, check whether the same engineer or the same asset shows up repeatedly. Clustering by resource is usually a faster diagnosis than clustering by customer complaint.
How an operations platform reduces measurement error
Most SLA disputes aren't disagreements about performance. They're disagreements about whose timestamp is correct, because response time lived in one system, job completion lived in another, and nobody reconciled them before the customer report went out.

A connected operations platform removes that gap by keeping jobs, engineers, assets and compliance records in one place, so every SLA calculation pulls from the same timestamped source rather than three exports stitched together.
What matters practically:
- Timestamped events for job acceptance, engineer arrival, completion and sign off, captured automatically rather than typed in after the fact
- Contract and planned preventative maintenance (PPM) tracking that flags upcoming obligations before they lapse into a breach
- Certificate and audit trail management that turns compliance checks into evidence, not a spreadsheet someone updates monthly
Start with the metrics that expose you contractually. Instrument those first, add dashboards once the data is trustworthy, and expand from there rather than trying to digitise everything on day one.
Common benchmarks and targets for SLA metrics
Benchmarks vary sharply by industry, so treat any single number as a starting point rather than a rule. For MTTR, faster is obviously better, but the meaningful benchmark is trend, not a single absolute figure, since acceptable recovery time depends heavily on what's actually failing.
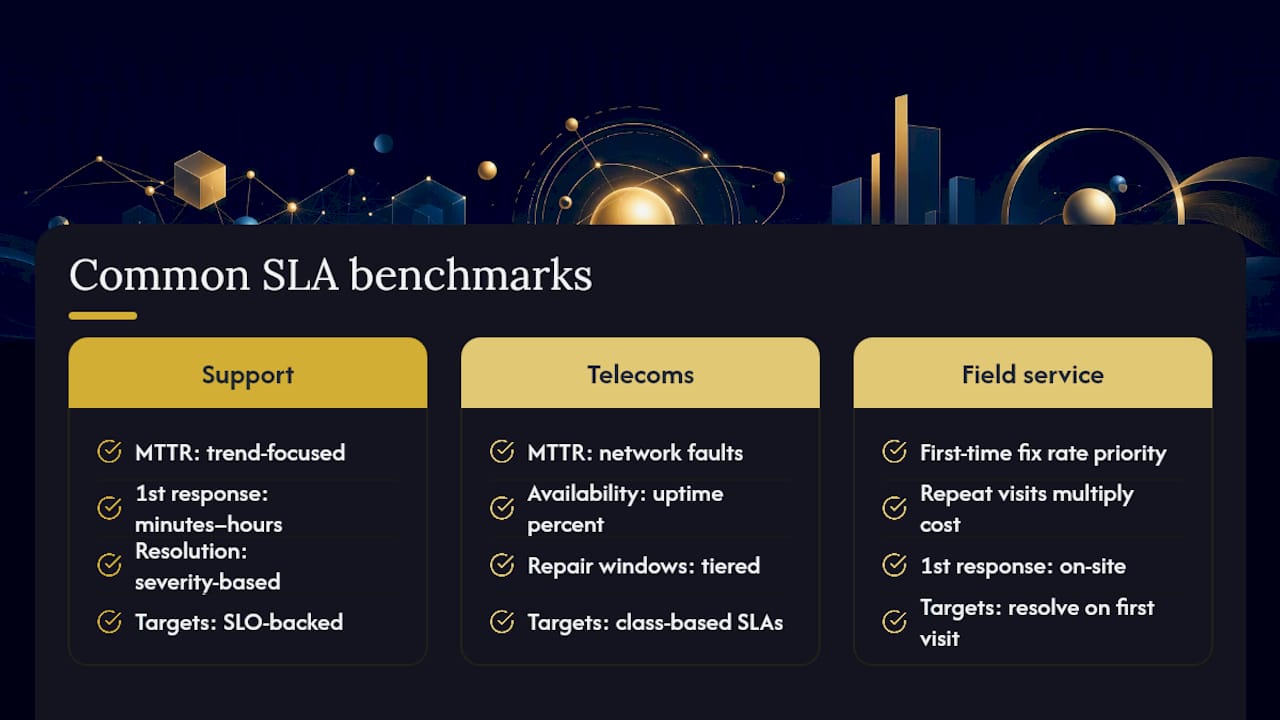
Support desks commonly target first response within minutes to a few hours depending on ticket priority, with resolution windows stretched to match severity, a critical outage gets a same-day target while a low-priority request might have days. Telecommunications SLAs often centre on network availability and fault repair windows, frequently with tiered targets by service class. Field service operations typically benchmark first time fix rate, aiming to resolve the issue on the initial visit rather than requiring a follow-up, because every repeat visit multiplies cost and erodes customer patience.
The honest answer to "what should our target be" is: whatever your measured SLO baseline supports, with a sensible buffer beneath it. A target borrowed from an industry benchmark that your own systems have never proven they can hit is not a target, it's a liability waiting for its first bad month.
Challenges and pitfalls in defining and tracking SLA metrics
Definitional ambiguity causes more disputes than actual performance failures. "Resolved" can mean the ticket closed, the customer confirmed satisfaction, or the underlying root cause was fixed, three very different milestones that produce three very different resolution times from identical raw data. Write the definition into the SLA document itself, not just the target number.
Data fragmentation is the second recurring problem. When response times live in a helpdesk tool, job completion lives in a separate field service system, and compliance evidence lives in a spreadsheet somewhere, reconciling them for a monthly report becomes a manual exercise prone to error, and prone to whichever team is under pressure quietly rounding in their own favour.
Gaming the metric is a subtler risk. A team measured purely on first response time can hit the target by sending an automated acknowledgement instantly, while genuine resolution drags on for days. Pair every leading metric with a lagging one that catches this, first response alongside resolution time, FCR alongside reopen rate, so a team can't optimise one number at the expense of the outcome it was supposed to represent.
Finally, static targets in a changing business are a persistent trap. A target set when a team had five engineers doesn't automatically still make sense at fifteen, or when a customer base has doubled. Review SLA targets against current operational capacity at least annually, not just when a customer complains.
Impact of SLA metrics on customer satisfaction and business performance
Customers rarely read the SLA document line by line, but they feel every deviation from it immediately, usually as frustration long before they check whether a breach technically occurred. Response time in particular functions as a proxy for how much a customer feels valued. A fast acknowledgement, even before the problem is solved, measurably changes how a customer experiences the wait that follows.
The business consequences run two directions. Consistently meeting SLA targets becomes a retention and renewal argument, hard evidence during a contract review that performance justifies the price. Consistently missing them, particularly on MTTR and resolution time, does the opposite: it turns every renewal conversation into a negotiation from a position of weakness, service credits get invoked, and account teams spend renewal season managing a relationship instead of growing it.
There's an internal effect too, often overlooked. Teams that can see their own performance against target, in something close to real time, tend to catch drift before it becomes a customer-visible problem. Teams that only discover their numbers when the monthly report goes out are permanently reactive, fixing last month's problem instead of this week's. The metrics aren't just a customer-facing scorecard. They're the earliest warning system the operations team itself has.
The clearest lesson from how SLA compliance actually gets measured is that evidence quality determines whether a metric is defensible, not just whether the number looks good.
| Point | Details |
|---|---|
| Track the essential three | Availability, MTTR and response/resolution time protect most commercial contracts on their own. |
| Instrument before you negotiate | Measure the SLO baseline first; an SLA promised without data risks constant breaches. |
| Build in an error budget | Set the SLA looser than the internal SLO so normal variance doesn't trigger contractual penalties. |
| Reconcile your evidence sources | Logs, monitoring probes and ITSM tickets must agree before a compliance report goes to a customer. |
| Use one connected record for evidence | Curcle keeps job, engineer and compliance timestamps in a single system, reducing the reconciliation errors that cause SLA disputes. |
What the research gets right, and where it stops short
The conventional advice on SLA metrics treats the list of eight or ten indicators as the hard part. It isn't. Anyone can copy a metric list from a vendor page. The hard part, and the part most guidance skips past, is the plumbing underneath: whether your MTTR clock starts at the same moment every time, whether a reopened ticket gets counted once or twice, whether your response time and your resolution time come from the same source of truth or from two systems that were never meant to talk to each other.
Businesses that skip that groundwork and jump straight to setting targets are the ones who end up disputing their own numbers eighteen months later.
If you take one thing from this, it's the sequencing. Measure first. Set the internal target second. Only then negotiate the external one. Reverse that order and you're not managing service levels, you're just hoping.
— Luke Herridge
Get audit-ready SLA evidence without the spreadsheet reconciliation
Most of the pitfalls covered here, mismatched timestamps, reopened tickets counted twice, response times living in one system while job completion lives in another, come down to the same root cause: no single record of truth. Curcle's field service management software was built inside a real UK engineering business specifically to close that gap, capturing job acceptance, engineer arrival, completion and compliance sign off as timestamped events in one connected system rather than three exports someone has to reconcile by hand.
That matters most for compliance-heavy trades. Certificate tracking, PPM contract schedules and audit trails sit alongside job and asset data, so an SLA report pulls from the same source as the engineer's mobile app entry, not a separate spreadsheet compiled after the fact. Facilities management and multi-site operators get the same evidence at scale across multiple accounts and compliance obligations. If your SLA reporting currently depends on someone manually cross-checking three systems before every customer report, book a look at how the platform handles it and see whether that reconciliation work disappears.
Sources
For definitions and measurement detail beyond this guide: Google Cloud's SRE fundamentals, IBM's SLA metrics overview, AWS's SLA explainer, BMC's compliance processing documentation, and AlertOps on KPI versus SLA.
- SRE fundamentals: SLIs vs SLOs vs SLAs | Google Cloud Blog
- Types of Service Level Agreement (SLA) metrics | IBM
- SLA metrics: How to measure & monitor SLA performance | Freshworks
- KPI vs SLA: the enterprise operations breakdown | AlertOps