
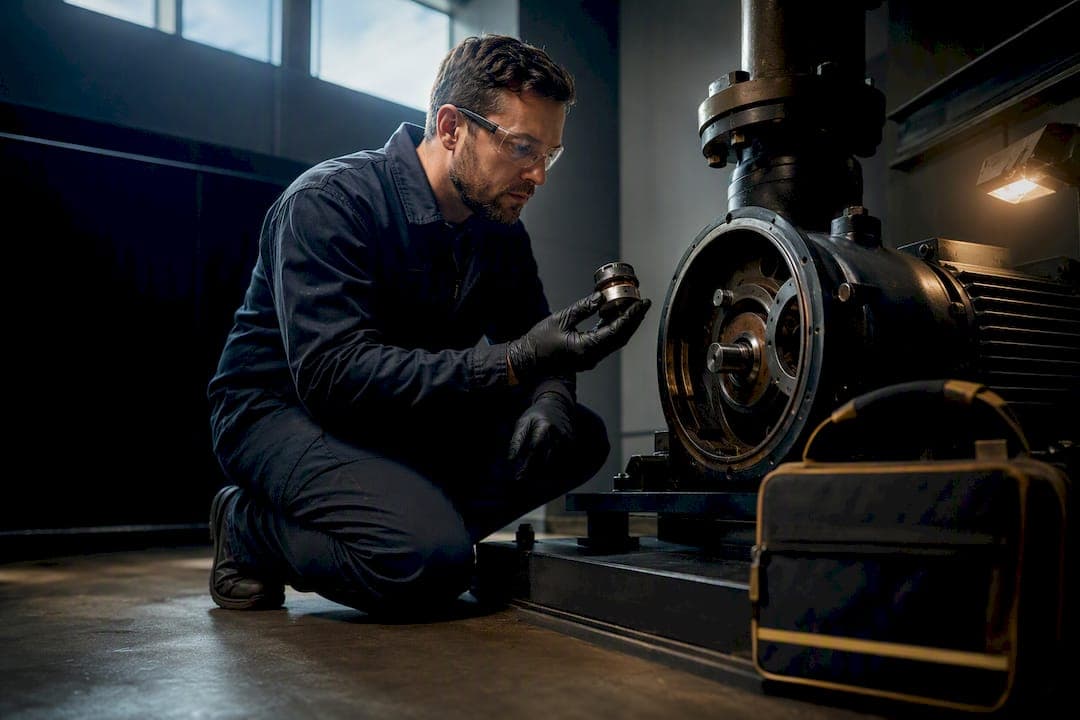
First-time fix rate (FTFR) measures the percentage of jobs your engineers resolve completely on the initial visit, with no return trip, extra parts, or escalation needed. It sits at the centre of field service profitability: every failed first attempt means a second truck roll, a delayed invoice, and a customer who now doubts you. Average performers sit around 75 to 80%, while the best operators push past 88 to 90%.
TL;DR:
- Improving FTFR from 76% to 85% can eliminate around 90 repeat visits per 1,000 jobs, significantly boosting margins and customer satisfaction.
- The most common causes of low FTFR include inventory gaps, incomplete job data, skills mismatch, scheduling issues, and communication breakdowns, which are all fixable.
- Measurement should use a reopen window of 14 to 30 days and confirm resolution with the customer to ensure accurate tracking of first-time fixes.
- Building an integrated, offline-capable operational platform that manages job, asset, and stock data ensures better dispatch and reduces repeat visits.
- Focusing on data quality, logistics, and measurement discipline is more effective than solely training engineers or rushing automation to improve FTFR results.
Table of Contents
- What is first-time fix rate and how do you calculate it?
- Why does first-time fix rate matter so much?
- What causes low first-time fix rates?
- How do you actually improve first-time fix rate?
- How should you measure and report FTFR without misleading yourself?
- How does an integrated operations platform support better FTFR?
- What actually moves first-time fix rate?
- Sources
What is first-time fix rate and how do you calculate it?
FTFR is the percentage of jobs completed during the first visit without needing a follow-up visit, supplementary parts, or outside support. The formula is straightforward:
FTFR = (jobs completed on first visit ÷ total jobs) × 100
The tricky part is deciding what counts as "completed." A job where the engineer diagnoses the fault but has to order a part isn't a first-time fix, even if they were on site once. Neither is a repair that looks finished but triggers a callback within your agreed window. PTC's guidance recommends applying the same formula at organisation, team, or individual technician level so you can spot where performance actually breaks down.
To build a measurement process that holds up to scrutiny:
- Define "completed" in writing, including how partial fixes and pending parts are treated.
- Set a reopen window (commonly 7 to 30 days depending on job complexity) during which a repeat call counts against the original visit.
- Tag every job with a first-visit or repeat-visit flag at close, not retrospectively.
- Run the calculation weekly at minimum, and monthly for trend reporting.
Worked example: if your team completes 940 jobs in a month and 720 are resolved on the first visit, your FTFR is (720 ÷ 940) × 100 = 76.6%. Solid, but short of best-in-class.
Why does first-time fix rate matter so much?
FTFR is one of the few metrics that connects customer experience, cost, and technician productivity in a single number. A missed fix doesn't just cost the price of a second visit. It ties up a technician who could be on another job, delays the invoice, and often triggers a complaint that eats into your customer satisfaction rate.
Benchmark snapshot: Industry data puts the average FTFR around 75 to 80%, with best-in-class organisations reaching 88% to 90% or higher. Anything under 70% typically signals systemic problems with parts, planning, or dispatch.
The gap between average and best-in-class isn't cosmetic. Take a business running 1,000 jobs a month at 76% FTFR. Lifting that to 85% eliminates roughly 90 repeat visits a month. At even a modest cost per truck roll, that's a meaningful chunk of margin recovered without adding a single extra engineer. It also means 90 fewer customers waiting a second time for the same problem, which does more for retention than any loyalty scheme.
What causes low first-time fix rates?
Most FTFR problems trace back to one of five recurring failures, and they rarely show up alone. A parts shortage often coexists with poor intake data, because nobody flagged what the job would need before the engineer left the depot.
- Inventory gaps: the engineer arrives without the part, or van stock doesn't match what the job actually required.
- Incomplete job data: intake triage misses asset details, fault history, or photos, so the engineer diagnoses blind.
- Skills mismatch: a generalist gets sent to a job that needed a specialist, or a newer technician tackles a complex fault alone.
- Scheduling and access failures: the customer isn't available, a site permit wasn't arranged, or travel time was underestimated.
- Office to field communication breakdowns: critical updates (a part substitution, a site access code, a compliance note) never reach the engineer before arrival.
Each of these is fixable on its own, but they compound. A business with weak intake triage will also struggle with parts forecasting, because nobody captured what the job needed until the engineer was already standing in front of the fault.
How do you actually improve first-time fix rate?
Fixing FTFR works best as a layered effort: quick operational wins first, then the systemic changes that make the improvement stick.
Start here, this week:
- Audit van stock against your five most common job types and close the obvious gaps.
- Add a mandatory triage checklist to every incoming job (asset ID, fault description, photos, known parts needed).
- Review your last month of repeat visits and tag the root cause for each one.
Then build the systems that hold the gains:
- Introduce parts reservation so stock identified at intake is ring-fenced for that job, not double-booked.
- Build a simple skills matrix mapping technicians to job complexity, and pair juniors with mentors on anything above their level.
- Move to skills-based dispatch rather than nearest-available scheduling, and build in travel-aware time buffers so engineers aren't rushed.
- Give engineers mobile access to asset history, manuals, and step-by-step checks, so diagnosis doesn't rely on memory or a phone call to the office.
Parts forecasting deserves particular attention here. Findle Inventory's guidance on van-stock parity argues it's one of the fastest levers available, because it fixes the single most common cause of a wasted visit before the engineer even sets off.
Pro Tip: Don't automate dispatch or triage faster than your data quality can support. Skills-based matching only works if the skills matrix is accurate and the job data feeding it is complete. Automating a broken process just breaks it faster.
The caution that matters most: keep an offline mode for the mobile app. Engineers working in basements, plant rooms, and rural sites lose signal constantly, and a tool that fails without connectivity becomes another reason for a second visit.
How should you measure and report FTFR without misleading yourself?
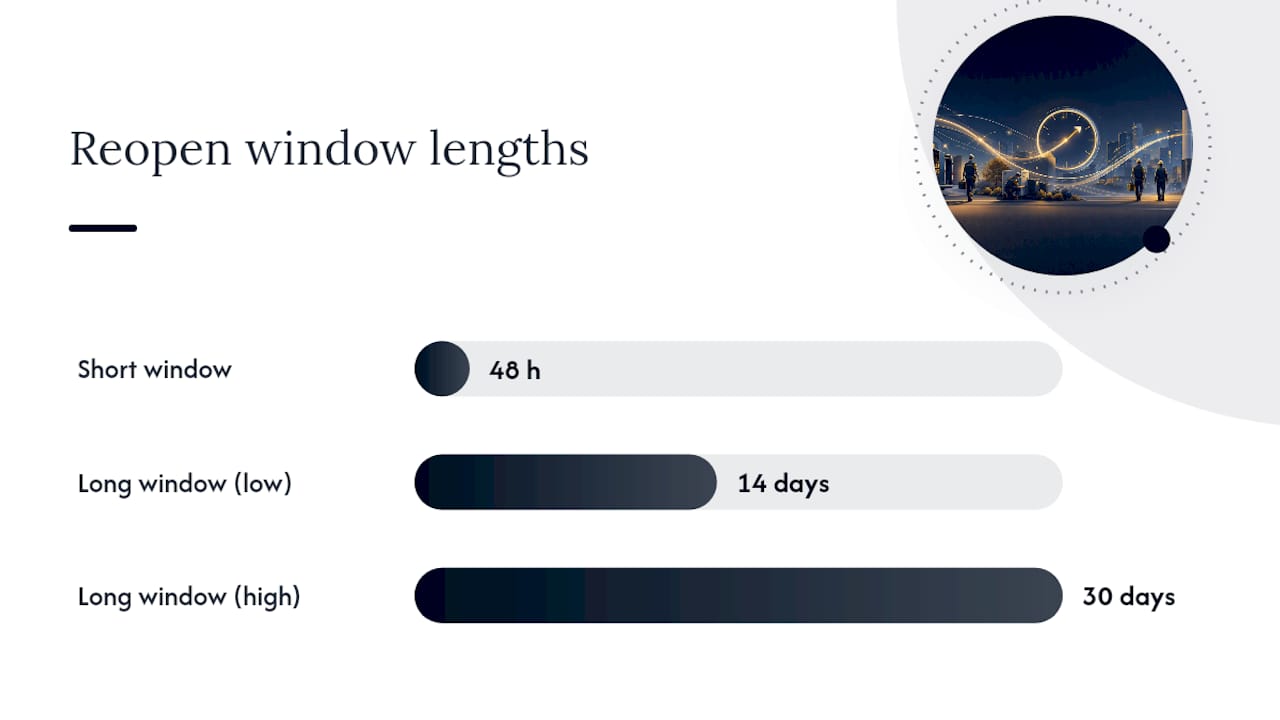
Measurement discipline is what separates a useful FTFR figure from a vanity metric. Two decisions matter most: how long your reopen window runs, and what counts as "resolved."
A short reopen window (say, 48 hours) flatters your FTFR by missing faults that resurface a week later. A longer window (14 to 30 days) is harder to hit but far more honest, particularly for mechanical or HVAC faults that can take time to fail again. Whichever you choose, document it and apply it consistently, because comparing FTFR across teams using different windows tells you nothing useful.
- Segment FTFR by job type, asset category, technician, and customer to find where the real problems sit, rather than reading one blended number.
- Look at cohort trends over rolling periods, not single-week snapshots, which swing wildly with small sample sizes.
- Track reopen rate alongside FTFR. Atlassian's guidance on first-call resolution warns against viewing a "first fix" metric in isolation, since teams under pressure can inflate it by closing jobs prematurely.
- Confirm resolution with the customer, not just the engineer's note. Salesforce's research on first-contact resolution points out that skipping this step skews the whole measurement.
- Add resolution rate, CSAT, SLA success rate, and average job cost to your dashboard so a rising FTFR isn't masking a drop somewhere else.
Why it matters: a technician chasing FTFR targets alone has an incentive to mark a job "fixed" and move on. Reopen rate is the check that catches that behaviour before it becomes a habit.
How does an integrated operations platform support better FTFR?
Most FTFR failures come down to information sitting in the wrong place at the wrong time: the parts count that wasn't updated, the asset history nobody checked, the skills gap nobody flagged before dispatch. A single source of truth for jobs, assets, and stock removes the guesswork that causes most repeat visits.
A workflow built around that principle looks like this: intake checklist captures the fault and asset ID, the system reserves the parts likely needed, dispatch matches the job to a technician with the right skills, and the engineer completes the job on a mobile app with full asset history to hand. A debrief step closes the loop for next time.
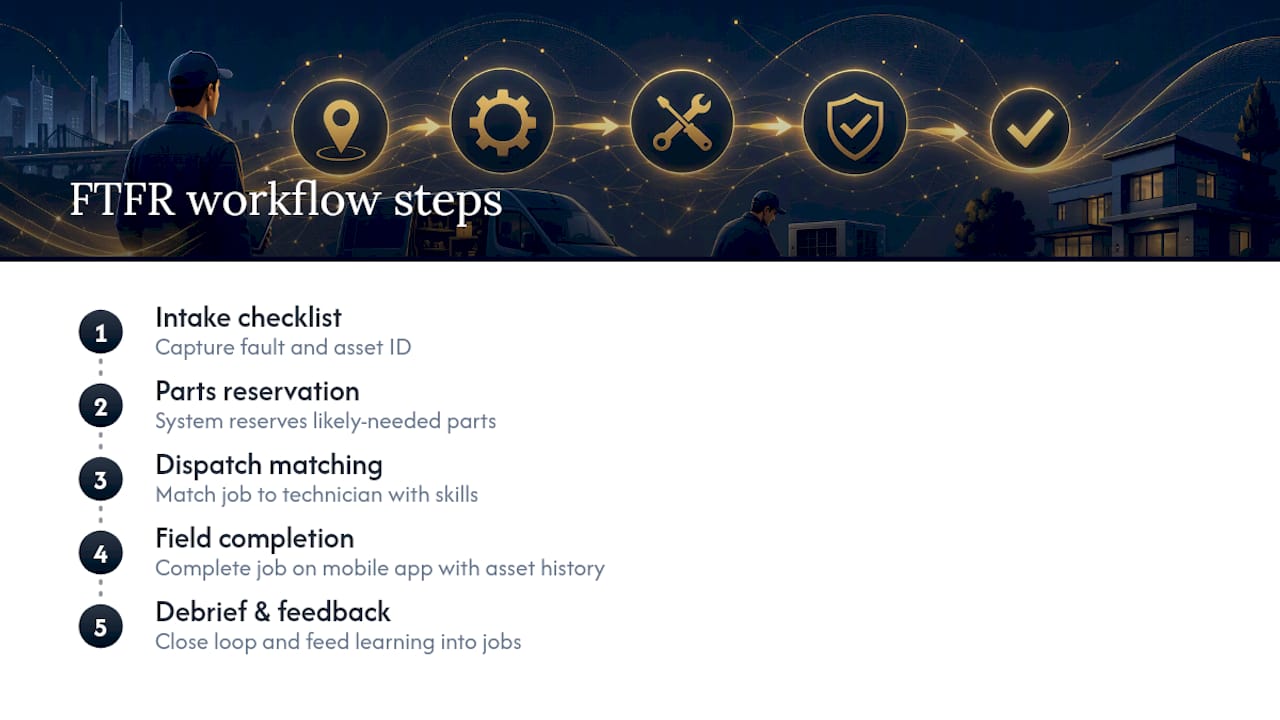
If you're evaluating software, prioritise offline-capable mobile access, parts reservation, asset history on every job, and role-based dashboards for the office. Curcle's field service management platform is built around exactly this operational sequence, though your own before-and-after FTFR figures will depend on your starting baseline and job mix.
What actually moves first-time fix rate?
Most FTFR advice online treats it as a training problem: send engineers on more courses, tighten their checklists, hope for the best. That's backwards. The research and the pattern of causes both point somewhere else: FTFR is mostly a data and logistics problem wearing a skills costume. An excellent technician with the wrong part in the van still fails the visit.
The conventional playbook also underrates measurement discipline. Businesses obsess over the tactics (better triage, better dispatch) while measuring the outcome inconsistently, using different reopen windows across teams or trusting the engineer's own "fixed" flag without customer confirmation. That's how a business convinces itself it's improving when reopen rate is quietly climbing.
If you take one thing from this: fix your measurement definition before you fix your process. Decide your reopen window, tie resolution to customer confirmation, and only then start chasing the parts and triage improvements. Otherwise you're optimising against a number you can't trust.
— Luke Herridge
Sources
- What is First-Time Fix Rate (FTFR)? | IBM
- What is First-Time Fix Rate? | PTC
- First call resolution (FCR) | Atlassian
- First call resolution (FCR) | Salesforce